

What is Analytics?
Analytics is the scientific process of discovering, interpreting, and communicating significant patterns in data. To put it simply, analytics helps us find useful and meaningful patterns in data and get new insights that we might not otherwise detect. Analytics uses data along with applied mathematics, statistics, predictive modelling and machine learning techniques to answer business questions, discover relationships, predict unknown outcomes and automate decisions. It helps enterprises in making better business decisions.
Categories of Data Analytics
Data Analytics can be divided into 4 categories:
- Descriptive: Descriptive analytics can help you answer a question about what something is. It is used as a means to explain something that has already happened to stakeholders. For example, it can track return on investment (ROI) and other metrics of past performance. It’s best to combine descriptive analytics with another method like diagnostic to go deeper into why something has happened. Descriptive analytics will point out what happened, but you will need to explore the reasoning behind the event still.
- Diagnostic: Diagnostic analytics provides insight as to why something happened. It works hand-in-hand with descriptive analytics to further explain critical findings. For example, diagnostic analytics can help answer why your team may have missed its targeted goals in a given period. If you take a look at key performance indicators (KPIs) and want to understand why something improved or got worse, then diagnostic analytics help to:
- Identify anomalies in data
- Collect the data that helps to understand the changes
- Uses statistical techniques to help explain such anomalies
- Predictive: Predictive analytics work to answer questions about what could happen in the future. It leverages past data to evaluate trends and estimate the likelihood of something recurring. Statistical analysis, regression and machine learning is used to make predictive analytics function.
- Prescriptive: Prescriptive analytics can help to make a decision about the future when you feel unsure about what should we do. It works by finding patterns from large datasets and then estimates the likelihood of different outcomes.
Importance of Data Analytics
Analytics has become the buzzword of this decade. All types of businesses are focusing on using it to change the way they make decisions. It can be said that data is the backbone of today’s business, as data-driven decision-making enables business leaders to make informed choices quickly to boost revenue, improve productivity, and stay a step ahead of the market.
Organizations today are collecting tremendous amounts of data, running to terabytes (and even petabytes). This is mainly due to the recent technological advances and the affordability of software and hardware. As a result, companies have all the raw data possible, and hence they are in dire need of experts who can make sense of all it and draw relevant outcomes. If not analysed this data is going to get wasted whereas if analysed properly this data can help us in finding information that is powerful to bring in a change in the patterns of how business is already working or going.
Recent advancements in technology have increased the potential of analytics. More data, better and cheaper storage options, stronger computational power, distributed and shared processing capabilities, and more algorithms make it easier to apply analytics to large problems and derive answers from data – in every industry.
Data analytics has countless applications. Some of the industry usages are:
- Healthcare: Data analytics can be used to serve patients efficiently and monitor the quality of care. Machine learning is being used to optimise treatments, patient flow and how equipment functions within the healthcare system—this analytics help to save billions of dollars globally.
- Energy Management: Utility companies can use data analytics to track network performance across millions of data points within their network. This way, they can dispatch crews for maintenance, quickly address service outages and optimise energy distribution.
- Finance: Finance companies and banks can use data analytics to help manage risk, optimise process flow, improve compliance and predict lifetime customer value, etc.
Skills, Processes & Tools
Data Analytics as a term refers to the processes, tools and techniques of data analysis and management, including the collection, organization, and storage of data.
The top skills needed for data analysts include:
- Structured Query Language (SQL)
- Microsoft Excel
- Critical Thinking
- R or Python-Statistical Programming
- Data Visualization
- Presentation Skills
- Machine Learning
The various processes involved in Data Analytics are:
- Data preparation: Taking raw data and getting it ready for analysis
- Data mining: Applying algorithms to raw data to uncover new insights
- Data modelling: Defining database entities to put raw data into
- Data discovery: Collecting data and putting into categories
- Data warehousing: Gathering data from multiple sources and putting it all together
- Data processing: Turning unstructured data into data ready for analysis
- Data integration: Combining different kinds of data into a unified system
- Data transformation: Converting data of one kind into data of another kind
SAP Analytics Portfolio
The SAP Analytics (DW, BI & Planning) portfolio now consists of the following products:
- SAP Analytics Cloud: It combines BI, augmented and predictive analytics, and planning capabilities into one cloud environment. As the analytics layer of SAP’s Business Technology Platform, it supports advanced analytics enterprise-wide.
- SAP BusinessObjects Business Intelligence (BI) suite: It is a centralised suite for data reporting, visualisation, and sharing. As the on-premise BI layer for SAP’s Business Technology Platform, it transforms data into useful insights, available anytime, anywhere.
- SAP Crystal solutions: SAP Crystal solutions include analytics and reporting software solutions, like SAP Crystal Reports & SAP Crystal Server, for small and midsize businesses. The different products enable deeper insights into business information and can help you position your organisation for a greater competitive advantage.
- SAP Data Warehouse Cloud: It unifies data and analytics in a cloud solution that includes data integration, database, data warehouse, and analytics capabilities to help you unleash the data-driven enterprise. Built on the SAP HANA Cloud database, this software-as-a-service (SaaS) empowers you to better understand your business data and make confident decisions based on real-time information.
- SAP HANA: It is a high-performance in-memory database that speeds data-driven, real-time decisions and actions. As the data foundation of SAP Business Technology Platform, SAP HANA provides advanced analytics on multimodel data, on premise and in the cloud.
- SAP BW/4HANA: It is a packaged data warehouse based on SAP HANA. As the on-premise data warehouse layer of SAP’s Business Technology Platform, it allows to consolidate data across the enterprise to get a consistent, common view of the data.
- SAP Business Planning Consolidation (SAP BPC): This application delivers planning, budgeting, forecasting, and financial consolidation capabilities, so you can easily adjust plans and forecasts, speed up budget and closing cycles, and ensure compliance with financial reporting standards.
SAP Analytics Cloud
SAP Analytics Cloud is SAP’s flag-ship product in the overall Analytics portfolio and the move to a single analytics product based in the cloud, cover multiple aspects, such as business intelligence (BI), planning, predictive, and application building. It is considered one of the best Corporate Performance Management (CPM) tools. Recent advances in the platform have made it on par with the leading competitors, and the competitive subscription pricing has made it very attractive compared to them.
SAP Analytics Cloud was first released in November 2015 (back then under the name SAP Cloud for Analytics, then renamed SAP BusinessObjects Cloud for a short period). The product itself is updated every two weeks by SAP, which includes bug fixes as well as new features and functionality. However, the biweekly update cycle is only performed on partner and non-productive tenants, whereas productive customer tenants are updated every quarter. SAP calls this update pattern the quarterly release cycle. The quarterly release cycle updates contains the same bug fixes and features or functionality as were shipped in the biweekly releases up to the point of the quarterly release cycle release.
SAP Analytics Cloud SaaS Platform
SAP Analytics Cloud (SAC) is designed to meet the needs of data visualization in the cloud. It is delivered as an all-in-one, Software-as-a- Service-based product. It covers the needs of data visualization, budget planning, and augmented predictive analytics, integrated all in one solution.
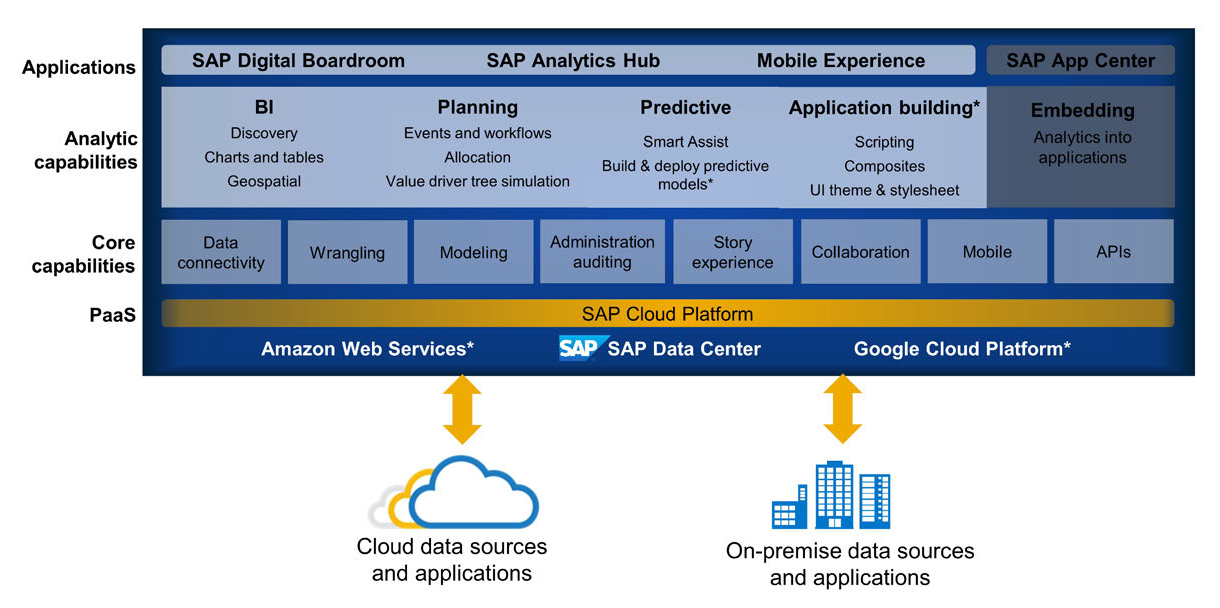
Core capabilities of SAP Analytics Cloud include:
- Data connectivity: SAP Analytics Cloud can connect to various on-premise and cloud data sources.
- Data preparation and data wrangling: Data wrangling refers to the preparation of data during the interactive data analysis and model building. It involves cleaning, structuring and enriching raw data into a desired format for better decision making in less time.
- Data Modeling: It is the process of visualizing and representing data for storage in a data warehouse.
- Story Experience/Dashboard Design: A dashboard is a collection of several views, letting you compare a variety of data simultaneously. A story in SAC is a presentation-style document that uses charts, visualizations, text, and images to describe data. Visual elements are arranged in Analytical Stories to tell the story of your business or organization and help you discover insights hidden within your data. When creating a story in SAC, only models will be used to connect to data.
- Collaboration: SAP Analytics Cloud provides various collaboration features to enable team members to work together successfully:
- Teams can be created and members can be added, allowing sharing of stories or files with entire team.
- Calendar allows to check upcoming tasks, whether it is own tasks or tasks that you have previously created for others, and to create and assign tasks to other users.
- Notifications can be setup to notify you when users are invited to join a discussion, when a comment is added to a shared story, when reminders and tasks become due, etc.
- Discussions allow you to communicate with your team, in real-time or through notifications.
- Comments can be used to ask questions, get feedback, or include comments about specific data points available in the tables.
- Mobile: SAP Analytics Cloud Mobile Application allows SAC users to access SAC content like stories from their iPhones, iPads, and supported Android devices.
- Application Programming Interfaces (APIs): SAC provides URL and REST APIs, which allow developers to extend the capabilities of SAP Analytics Cloud. For example, SAP Analytics Cloud Story can be embedded using URL API and SAML2 SSO, on a corporate website.
- Administration: The administration capabilities of SAC can be divided into Security & System Administration areas. Security features include Users, Teams, Roles, Activities log, etc. System Administration features include Monitor System Usage, System Configuration, Datasource Configuration, R Configuration, App Integration, Notification settings, Catalog, etc.
The main components of SAP Analytics Cloud are shown below:
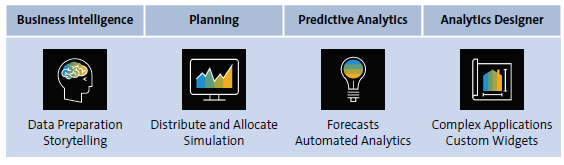
- Business Intelligence: The area of business intelligence combines all functionality, ranging from data connectivity to reporting and collaboration. That not only includes the option to upload data to SAP Analytics Cloud but also to define models from scratch or fix quality issues in uploaded data. Storytelling, which is SAP Analytics Cloud’s notation for reporting, is a very strong feature of business intelligence that allows business and IT users easy and intuitive access to their data.
- Planning: Planning in SAP Analytics Cloud covers a broad planning engine consisting of various tools and functionality that enables the establishment of complete planning processes. Therefore, data models are extended by planning-specific properties, and some additional functions are provided to better analyze key performance indicators (KPIs). On top of that, users can create input-ready forms, apply extended formulas, or create additional chart types like the value driver tree.
- Predictive Analytics: When it comes to predictive analytics, SAP Analytics Cloud offers various automated and manually executed processes to users. The automated functionalities are designed to offer business users an easy introduction into machine learning and the application of statistical methods to data. For more advanced users or data scientists, there are various additional options that offer a broader flexibility. Power users especially often have strong requirements or need very strong fine-tuning options. Furthermore, there are many company-specific requirements or quality needs to consider, which make the field very complex.
- Analytics Designer: The analytics designer was released last year and is therefore the newest component of SAP Analytics Cloud. It allows for building complex analytical applications that enable power users to extend standard reports by using scripting and defining more detailed settings on chart behavior, filters, or other elements. When compared with storytelling and business intelligence, the analytics designer is clearly different from the self-service approach. It’s designed for power users who are building individual and heavily customized dashboards for business departments and users and providing them afterward. Business users can just consume these dashboards as such, without spending time to configure or modify them.

SAP Analytics Cloud Smart Features
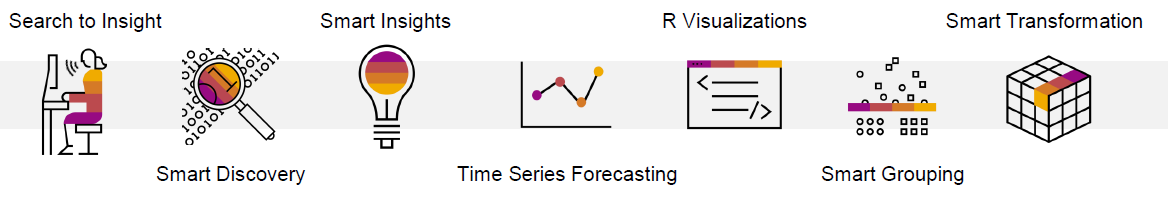
SAP Analytics Cloud offers many smart features for improving business decisions and analysis workflow. SAC provides business users, who have no data science training, with a range of easy-to-use machine learning capabilities integrated seamlessly into business processes and workflows. These augmented analytic capabilities include:
- Search to insight, which provides conversational analysis capabilities where the user asks questions in real language terms and it automatically provides analysis that can then be drilled into for more insights.
- Smart Insights, which surfaces correlations in the data to help users better understand any relationships providing automatically generated charts and text.
- Time Series Forecasting, which helps users make confident decisions on time series data by predicting future values based on historical data.
- R visualization, where users can write R scripts and insert the R visualizations into stories.
- Smart Grouping, which automatically creates segments on different types of data.
- Smart Discovery, which explores data to reveal relationships and hidden patterns using a range of automated machine learning algorithms that all run under the bonnet.
- Smart predict, which provides the automated machine learning algorithms to business users and enables them to build trusted and actionable predictions without needing any support from a data scientist. Also, smart predict’s time series forecasting capabilities can be used seamlessly to augment SAC’s budget planning functionality, providing accurate predictive planning for business planners.
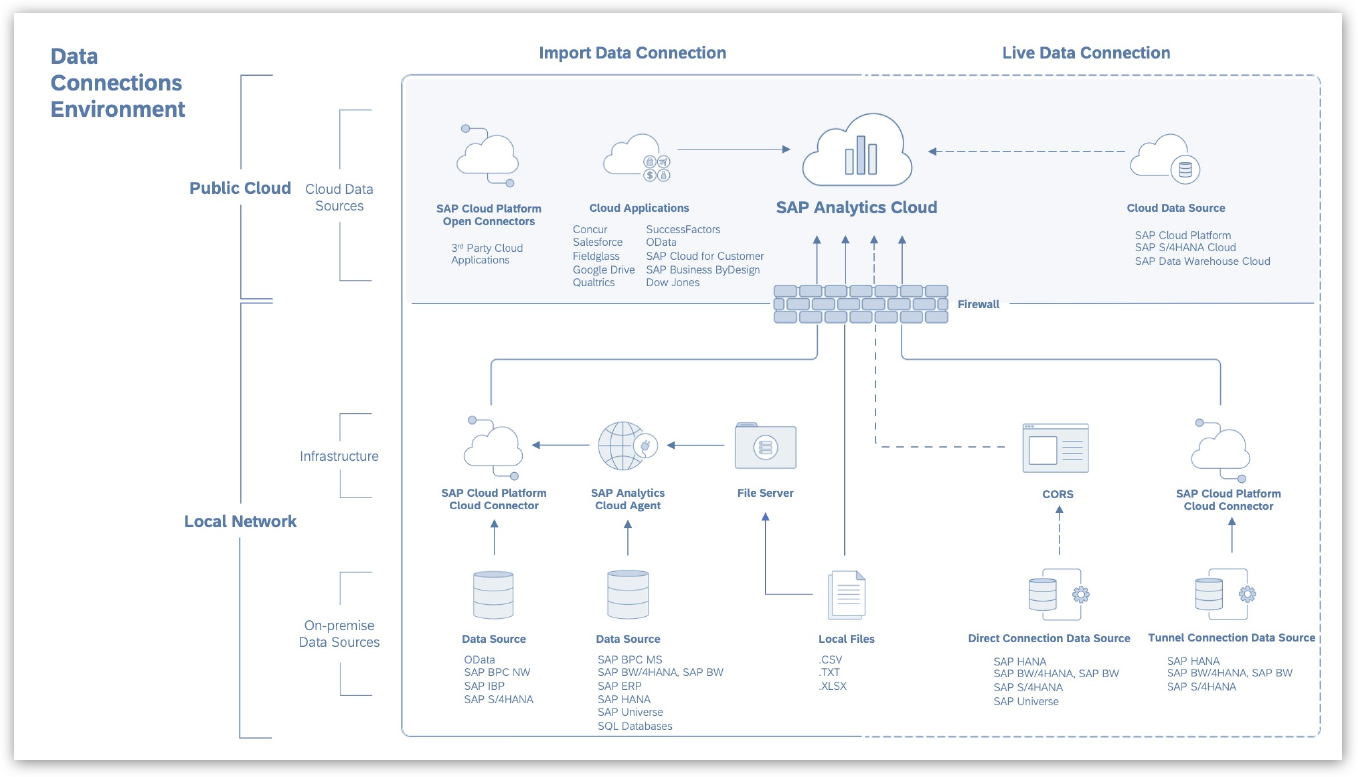
Data Connectivity in SAC
SAP Analytics Cloud can connect to various on-premise and cloud data sources. There are 2 types of connections possible (for both cloud and on-premise data sources):
- Live Data Connections
- Import Data Connections
Live Data Connections
- All data stays within the remote (customer) landscape or source system. The data is not replicated to SAP Analytics Cloud.
- Modeling and model security is managed on the source system.
- Data visualizations and stories are updated with new data in real-time.
Import Data Connections
- All data from your data source is uploaded (replicated) to SAP Analytics Cloud in-memory HANA Database. SAP Analytics Cloud then stores the model and data.
- Data is encrypted and security can be added to the model within SAP Analytics Cloud.
- New data models can be created through the SAP Analytics Cloud Modeler
- Data visualizations and stories are updated when refreshed
OptiEXIM Analytics
IVL is providing Integrated Product Analytics based on SAP Analytics Cloud for all of it’s SAP based compliance solutions including OptiEXIM.
Some of the key highlights of the OptiEXIM Analytics solution are:
- Generation of valuable insights from the available EXIM data
- KPIs and Analytical Reports catering to various user groups
- Built on best practices
- Accelerated Go-Live
- Visibility of supply chain
Analytics for Various EXIM User Groups
| Treasury Team | Foreign Inward Remittance (Cash Inflow) |
| Incentive Team | Visualizing Exports Incentives at Shipping Bill level |
| Logistics Team | Consolidated view of the Shipping Bill related info including BRC/BL Status |
| Sales & Marketing | Tracking Export turnover with Sales KPIs |
| Treasury & Sales Team | Insight to Letter of Credit Utilization with Balance checks |
| Logistics Team | Total Visibility on Import shipments & Customs clearance |
| CFO & Team | Monitoring the Cash Outflow |
| Procurement Team | Country wise Import details with Material Information |
FAQ
Share this Post
About the Author
Recent Posts
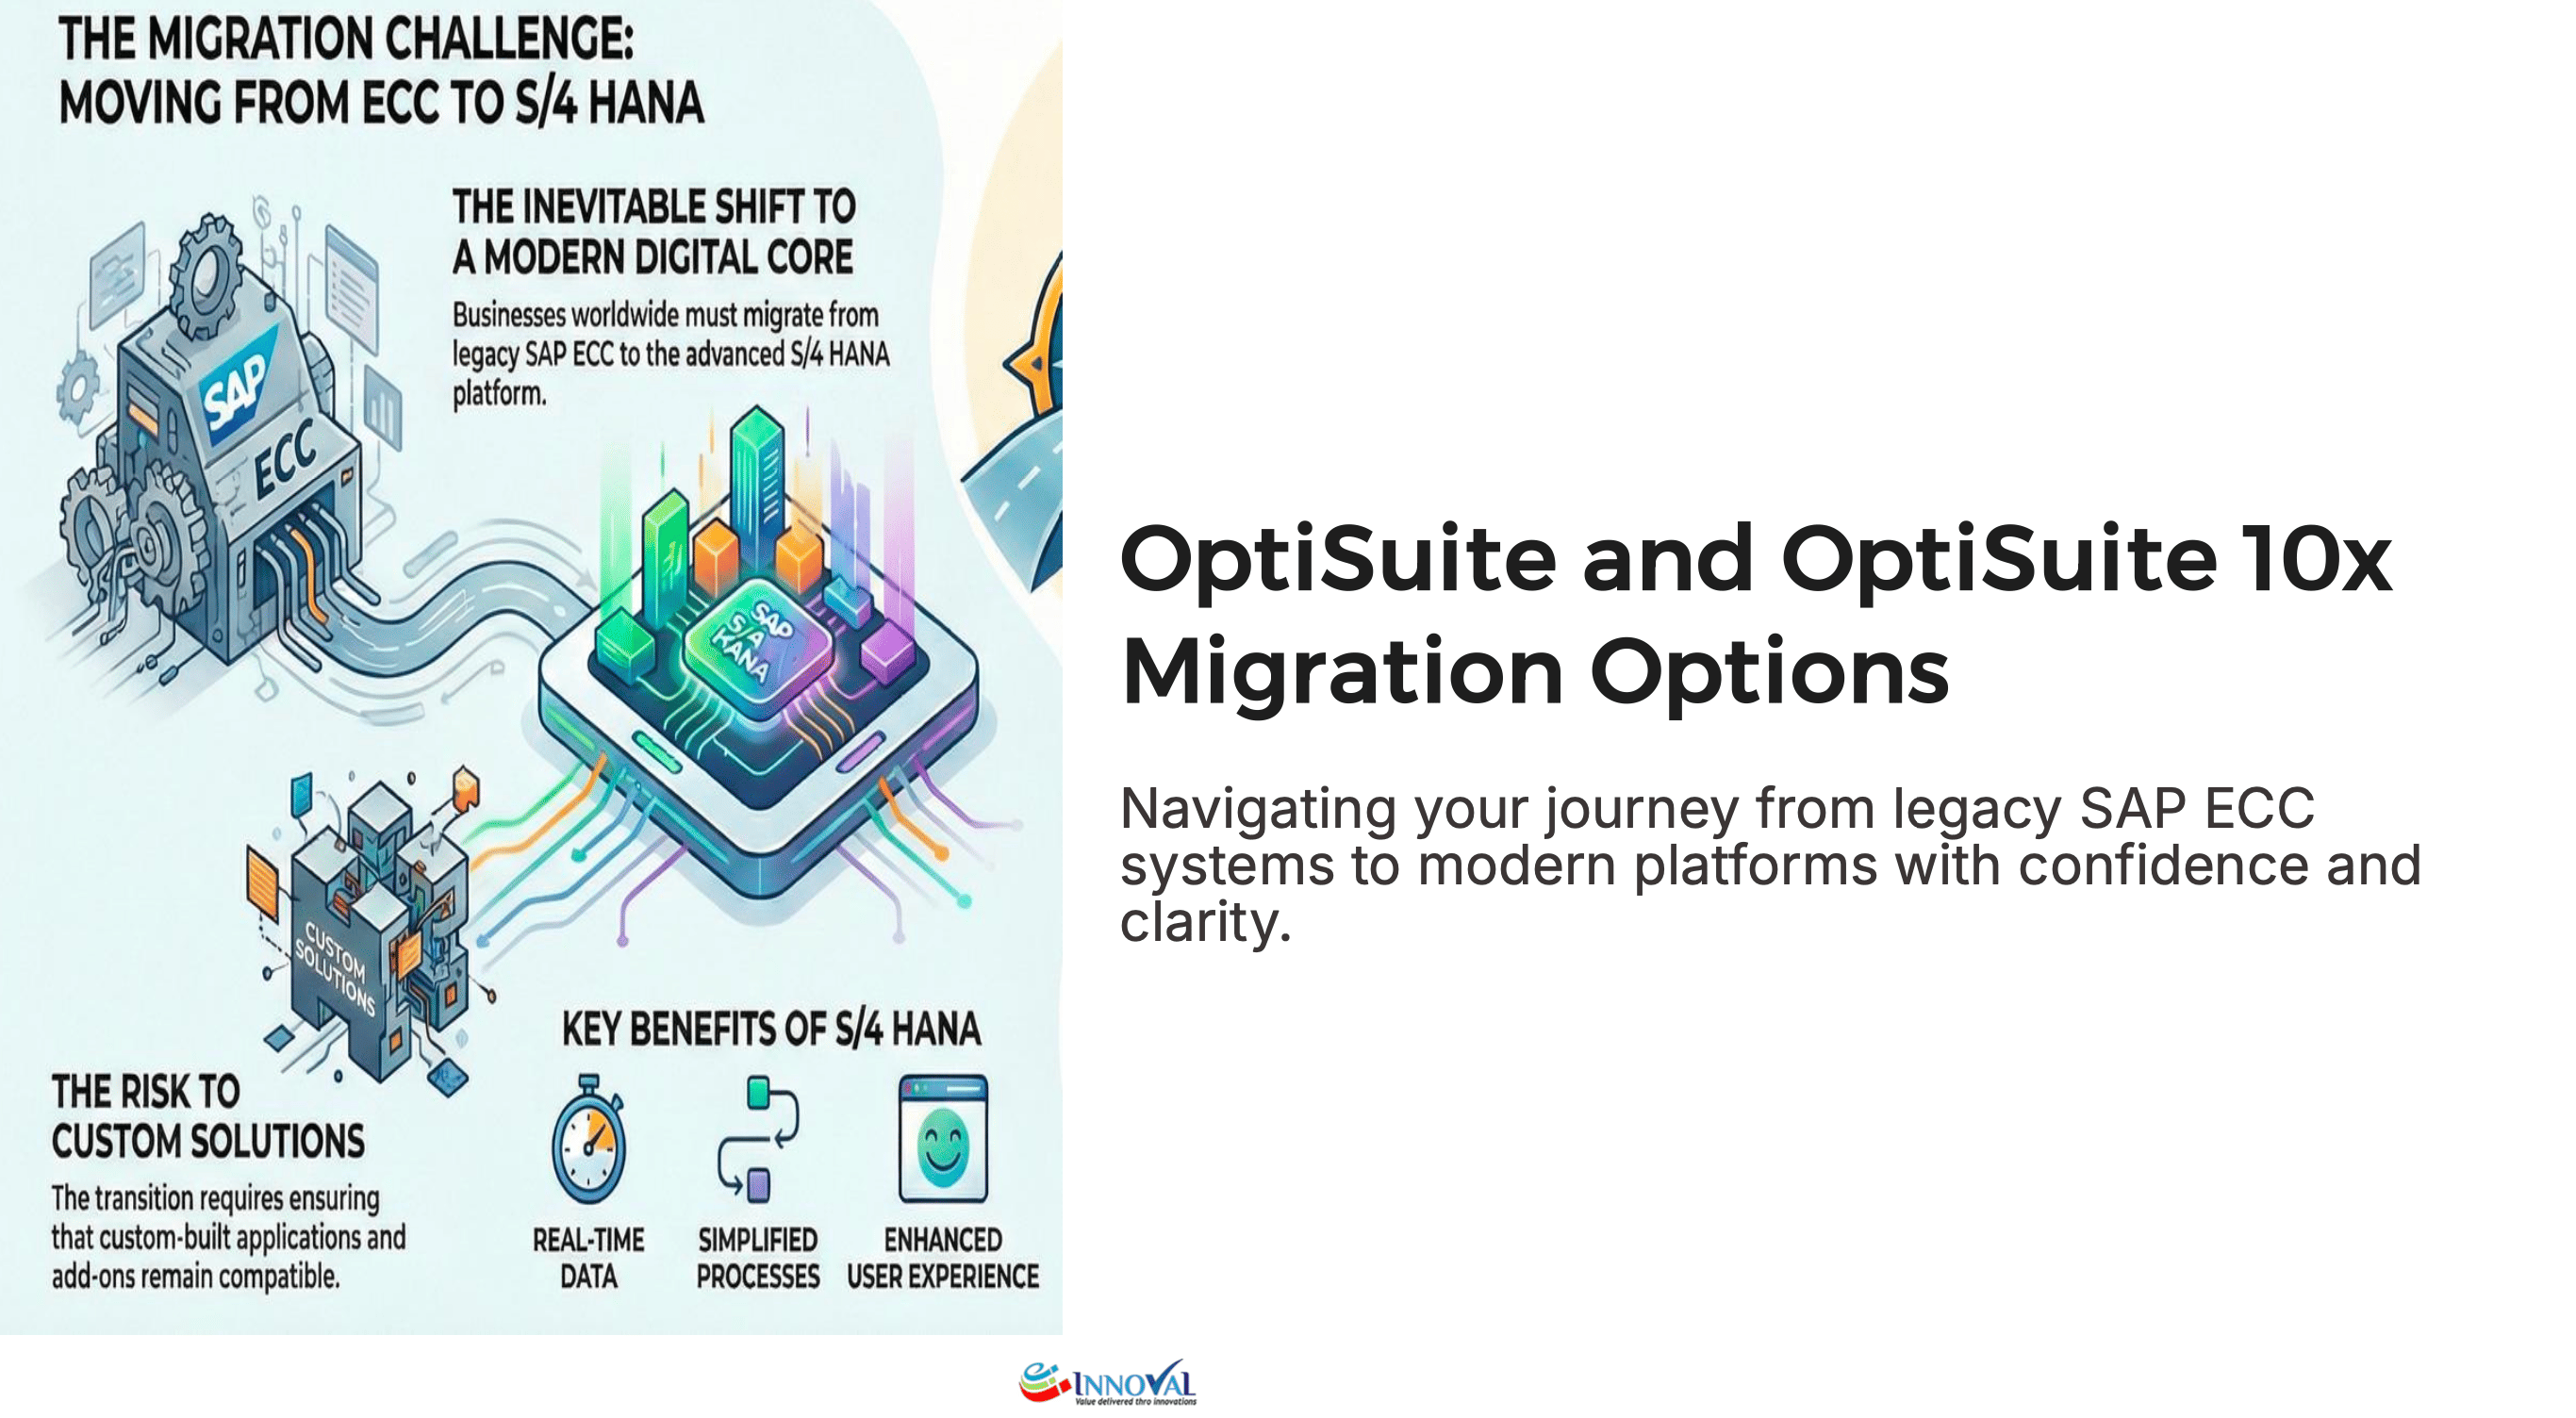
OptiSuite and OptiSuite10x Migration Options
Navigating your journey from legacy SAP ECC systems to modern …Read More »
Driving Enterprise Transformation with Practical Generative AI

Connecting ERP Systems with Government Portals in India – A Practical Guide for Exporters & Importers
In today’s fast-paced global trade environment, Indian exporters and importers …Read More »
OptiVMS by IVL: Advanced SAP Vendor Management System | 30+ Years SAP Expertise
In today’s fast-paced business environment, efficient vendor management is critical …Read More »
Streamline Your SAP Procurement with OptiVMS: The Future of Vendor Management
In the digital era, businesses need agile, efficient, and secure …Read More »
What is RISE with SAP?
RISE with SAP is SAP’s flagship Business Transformation as a …Read More »
OptiSuite10x: The All-in-One SAP Add-On for Indian Enterprises’ Compliance and Trade Needs
For Indian enterprises navigating the complexities of indirect taxation, international …Read More »
Transforming GST Compliance in SAP ERP with IVL’s OptiGST Solution
For Indian enterprises running on SAP ERP, Goods and Services …Read More »
The Importance of the Right Partner for Your SAP BTP Journey

Is Global Trade Operating with Just 3 Documents? Let’s Check the Reality.


